There is growing consensus among digital health experts and researchers that we need to focus on measuring meaningful engagement.
Rather than relying on broad metrics like session count, weekly active users, or program completion rates, we should adopt a data-driven strategy to identify the engagement metrics that truly predict long-term success for each specific intervention.
For example, if Google Meet’s added value lies in its superior call quality compared to alternatives, the “aha moment” for users would likely be experiencing a call without any connection issues.
Similarly, LinkedIn identified the number of connections as a key engagement metric and found that long-term retention significantly increased when users added 10 connections within their first 10 days.

P.S. Full list of 16 popular healthcare product metrics you can find here -> Free Download
How can we determine the “aha moment” in the context of digital health apps? Let’s refer to the diagram below (and explain each of its points):

Step 1: Identifying Value Indicators
Understanding what value means to your users is a critical step, and it differs significantly between digital health interventions and traditional consumer products.
In social products like WebMD, user retention can be a solid measure of value, as people come back for reading. Similarly, in telemedicine products like HealthTap, retention reflects success in achieving communication goals.
For digital health products with interventions, the value comes from patient outcomes. If users engage with the app frequently but their health doesn’t improve, the app isn’t delivering the intended value.
Digital health products often cater to three key stakeholders—patients, providers, and payers—who all prioritize improved clinical results. Thus, patient outcomes serve as a universal value indicator.
For instance, in a digital health app targeting depression, the common goal for all stakeholders would be reducing depressive symptoms. This forms the foundation of the next step.
Step 2: Identifying Leading Indicators
Once the core value (for example, patient outcomes) is established, it’s time to pinpoint leading indicators that can predict this value—this becomes your “engagement metrics.” Generic metrics might not always be reliable; instead, identify specific actions within the app that link to clinical improvements.
Let’s continue with the depression app example. If your app is based on therapy, you’d look at what drives positive outcomes, such as:
– Attending regular sessions (translates to weekly app usage)
– Completing exercises (in-app tasks)
– Building rapport with the therapist (which could be measured through in-app interactions or feedback).
1. Mapping Theoretical Indicators to Specific Actions
The next step involves translating traditional predictors into measurable app actions. In this case:
– Regular appointments become active weekly usage.
– Completing homework translates into finishing in-app exercises.
– Measuring therapeutic rapport is trickier, but could be addressed through feedback forms.
2. Validating the Relationships
The final stage is to validate these metrics with real data. If consistent usage doesn’t correlate with better clinical outcomes, but completing specific tasks within the app does, then task completion becomes your meaningful engagement metric.
For example, if users who complete more exercises show better symptom improvement, that’s a reliable engagement indicator to track.
Step 3: Testing Causality
Correlation is important, but causality is the goal. You need to confirm whether boosting task completion directly leads to better clinical results. This can be tested by adding features like reminders or rewards for completing tasks and then seeing if clinical improvements follow.

For instance, if more users complete their exercises after receiving reminders, and this correlates with reduced depressive symptoms, you’ve found a causal link and a valuable engagement metric to guide future product development.

So, in our example, we determined that our AHA moment is the number of completed exercises.
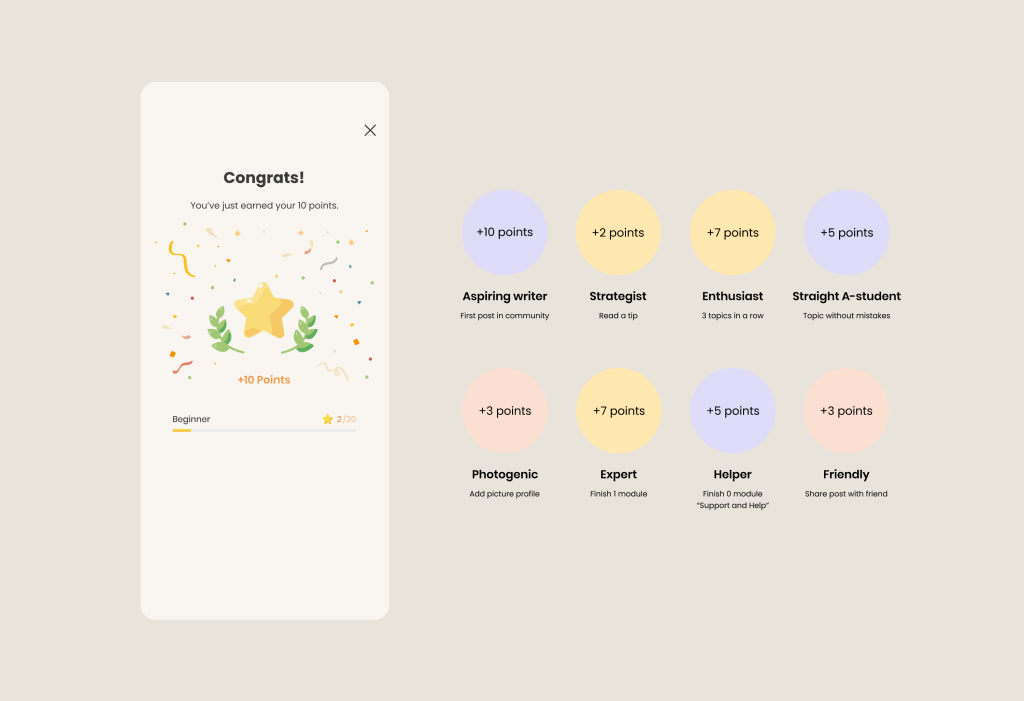
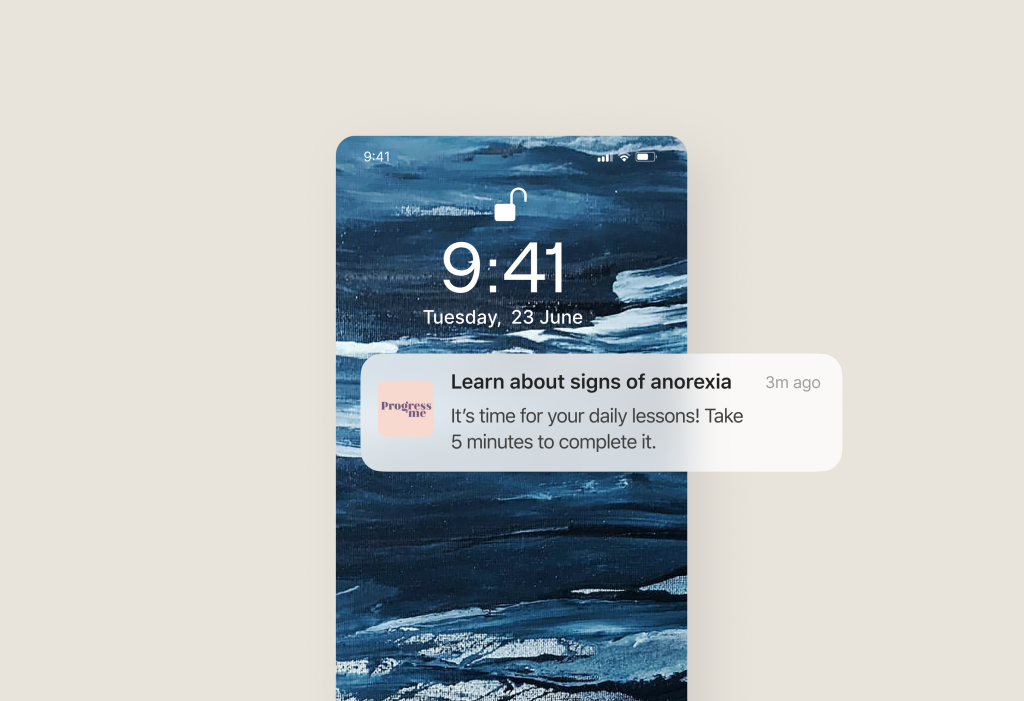
Then, we can enhance this metric by adding gamification elements and push notifications to increase our AHA moment. For example, in our practice, we integrated gamification elements into Moksha, such as rewards for completing exercises.
In result this app has higher average time spent in product, app opens, breathwork minutes, and AOV compared to leading meditation apps.

Minimum AHA Dose
Identifying meaningful engagement metrics is only part of the solution. The next step is to determine the minimum level of engagement necessary to create long-term value for users.
For example, if completing in-app exercises is linked to better patient outcomes, you’ll need to figure out how many exercises should be completed, and within what time frame, to maximize the chances of seeing significant clinical improvements.
Here, it’s essential to dive into product analytics. For example, we set up Amplitude for our partners. Below, you can download examples of ready-made templates that we’ve put together to simplify the data collection process.

Download Amplitude Analytics Templates for AHA moments and other metrics
Want to create the best AHA and a high user Engagement? We are a digital health product studio, who transforms healthcare digital experiences and sets new standards for delivering digital healthcare in a way that positively impacts people’s lives.
We assist healthcare startups in designing and developing digital products, while also helping healthcare organizations undergo transformative changes.

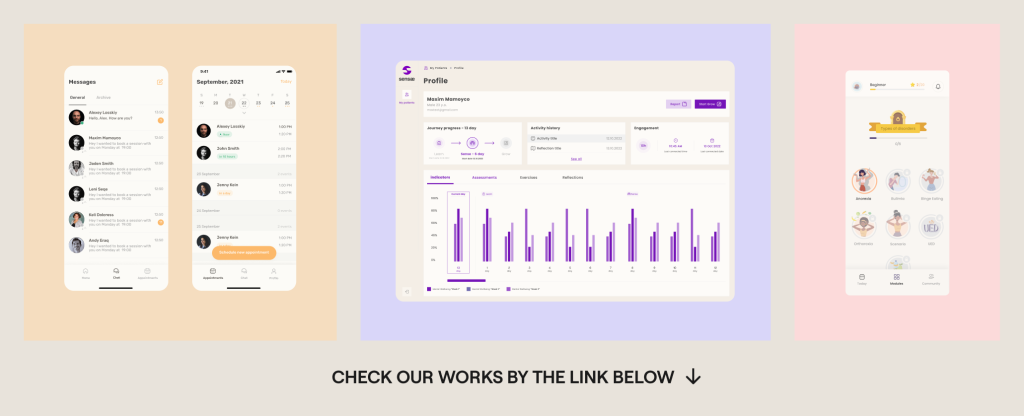
If you are interested about our experience check our portfolio with case studies: https://studio.nozomihealth.com/work
Or write to us now on m@nozomihealth.com and we will discuss how we can help ensure that your product brings real benefits


